Charts
Sketch Design System for Charts, Graph, and Diagrams
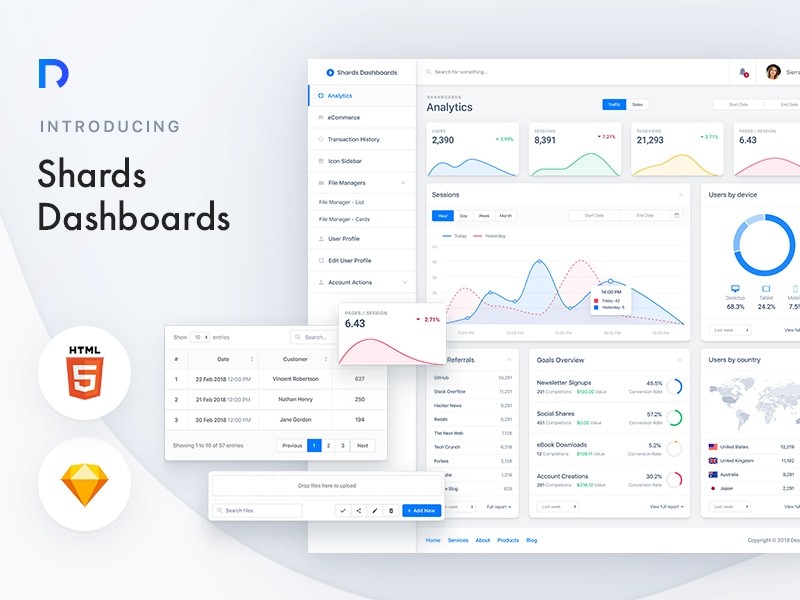
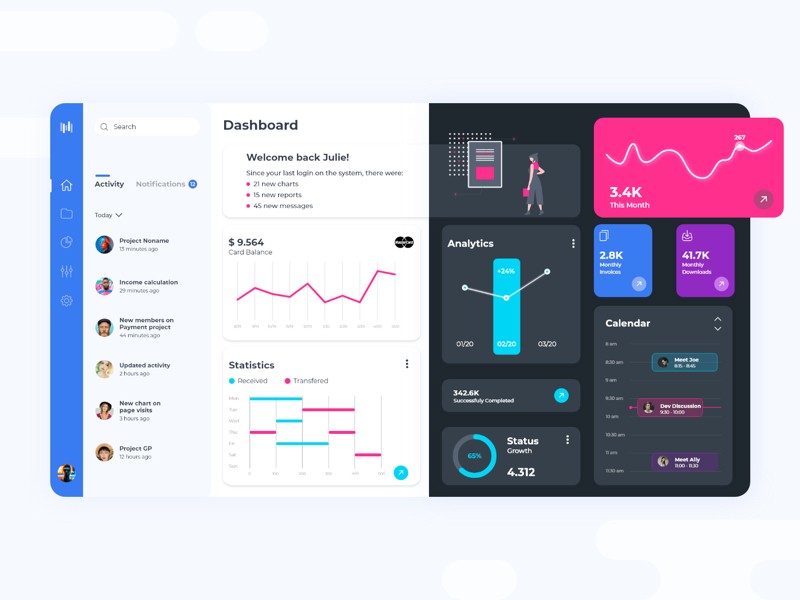
The most comprehensive collection of charts, graphs and diagrams. 92 charts in the 8 most popular categories. Every detail is customizable. Great for your next web and mobile projects!


Sketch Design System for Charts, Graph, and Diagrams
Welcome to Charts, your go-to platform for creating insightful and compelling visual representations of data. Whether you're a data analyst, business professional, or educator, Charts offers a versatile toolkit to transform complex data sets into clear, actionable insights.
Key Features:
Wide Range of Chart Types: Explore a variety of chart types including line charts, bar charts, pie charts, scatter plots, and more. Charts provides the flexibility to choose the best visualization method to effectively convey your data's story.
Interactive Visualization: Engage your audience with interactive charts that allow for exploration and drill-down capabilities. Customize tooltips, labels, and animations to enhance understanding and interactivity.
Real-time Data Updates: Keep your charts up-to-date with real-time data feeds and automatic refresh capabilities. Whether monitoring market trends or tracking project milestones, Charts ensures your visualizations are always current.
Why Choose Charts?
Charts stands out for its user-friendly interface, robust features, and ability to deliver impactful visualizations. Whether you're presenting insights to stakeholders, teaching students data literacy, or analyzing trends for strategic decision-making, Charts empowers you to make data-driven decisions with confidence.
Visualize Your Data with Charts
Transform data complexity into clarity with Charts. Join professionals across industries who trust Charts to visualize data, uncover trends, and communicate insights effectively. Ready to elevate your data visualization game? Explore Charts and unlock the power of visual storytelling today.
View More
View More
View More

Charts
The most comprehensive collection of charts, graphs and diagrams. 92 charts in the 8 most popular categories. Every detail is customizable. Great for your next web and mobile projects!
Related Product
Check out some similar products
UPDATES & RELEASES
Join Our Community
Join our newsletter list for occasional updates, products and insights.
UPDATES & RELEASES
Join Our Community
Join our newsletter list for occasional updates, products and insights.
UPDATES & RELEASES
Join Our Community
Join our newsletter list for occasional updates, products and insights.


